Outcomes
Are We Improving Floodplain Health in the Puyallup Watershed?
We are tracking outcomes and benefits in the floodplain
FFTF partners want to see improvements in floodplain health as it relates to agricultural viability, increases in fish and fish habitats, and reduced flood risk to people and property. While improvements from specific capital projects, such as levee setbacks, will be monitored at the project level, the following metrics aim to track trends at a different scale using both qualitative and quantitative means.
Overall Floodplain Status
This metric serves as a high-level qualitative assessment made by FFTF partners about the current status of the floodplain. FFTF Partners will come together from time-to-time to review results of ongoing monitoring and share first-hand knowledge to characterize the current status and condition of the floodplain. Partners will take into account the monitoring results, group knowledge, and other factors to come up with a qualitative status assessment of floodplain condition. Descriptive status categories (e.g., improving, staying the same, declining) will be discussed by FFTF Partners as well as potential weighting factors for determining status.
FFTF Goal(s):
All Goals
Baseline Year:
2021 (first year of reporting)
Status:
Metric results expected in 2021
Source(s):
FFTF Partners
Farm Businesses
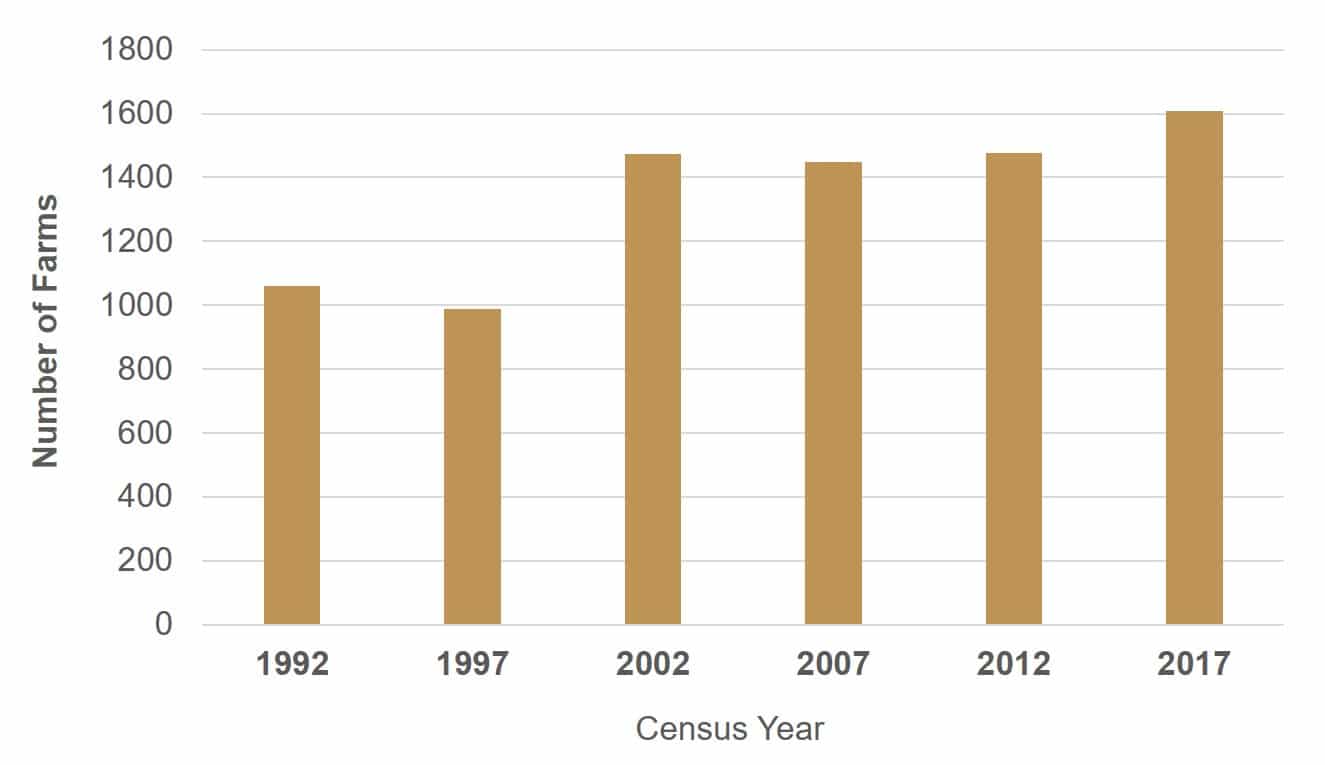
This metric reports data from the Census of Agriculture conducted by the U.S. Department of Agriculture. Census data is reported every five years and is measured across the county, not the watershed. Over the past 25 years, the number of farms in Pierce County has ranged from 989 to the 1,607 farms recorded in 2017. While the number of farms has gone up (1,607), the average farm size has gone down (28 acres) as of 2017.
FFTF Goal(s):
Maintain viable farming economy/critical mass of farmland and farm businesses
Baseline Year:
2012 USDA Census of Agriculture
Status:
Results from the 2017 Census data were reported in 2019
Source(s):
US Department of Agriculture (USDA) Census of Agriculture: National Agricultural Statistics Service (NASS)
- 2017 Result: 1,607 farm businesses in Pierce County
Farm Revenue
This metric reports data on the total market value of agricultural products sold from the Census of Agriculture. Although overall revenue declined substantially across the county (from $90,933,000 in 2012), the revenue from crops, which is the primary agricultural product in the Puyallup watershed, saw a $5.5 million increase from 2012.
FFTF Goal(s):
Maintain viable farming economy/critical mass of farmland and farm businesses
Baseline Year:
2012 USDA Census of Agriculture
Status:
Results from the 2017 Census data were reported in 2019
Source(s):
US Department of Agriculture (USDA) Census of Agriculture: National Agricultural Statistics Service (NASS)
- 2017 Result: $64,876,000 in total market value of agricultural products sold.
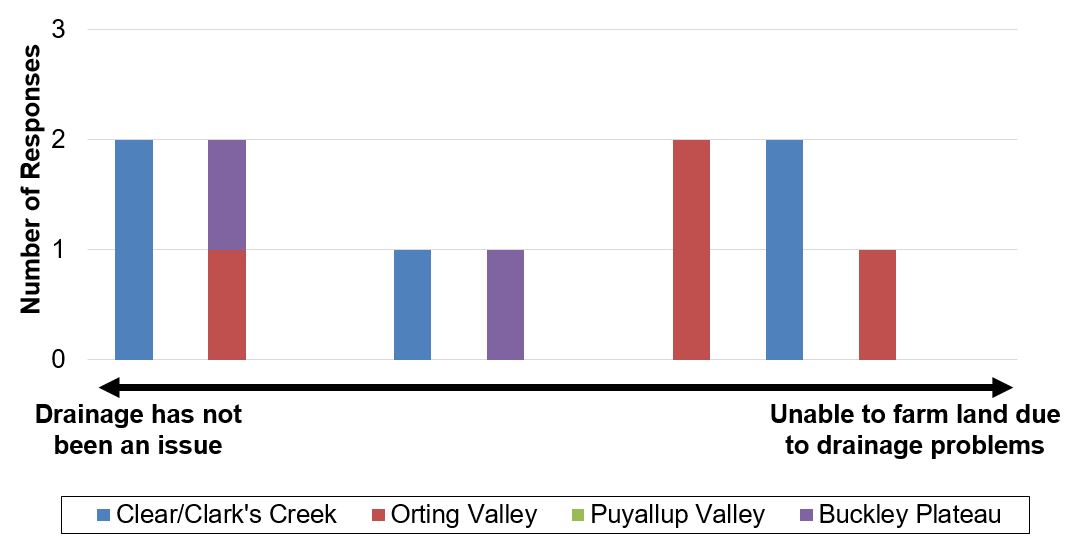
Farm Drainage
This metric uses a non-scientific survey to track responses from farmers in the Puyallup Watershed about drainage conditions on farms throughout the watershed for a given year. The total number of farmers who responded to the survey in 2018 and 2020 was 11, however these 11 farmers are not necessarily the same individuals for both survey years.
Poor drainage conditions can represent a major risk to agricultural viability. Good drainage is essential to agriculture because most crops cannot tolerate saturated soils or standing water during the growing season. Flooded or saturated fields can cause reduced crop yield or total loss of the crop. When fields remain saturated into the spring, it can delay planting of crops. Saturated soils or standing water in the winter can prevent farmers from planting cover crops, which many farmers use to prevent soil erosion and runoff while adding nutrients to the soil.
Results represent conditions in each given year and likely represent variability as opposed to a trend. The results suggest that both drainage conditions and sensitivity to drainage issues vary from farm to farm, even amongst famers in the same geographic area. Generalizations about farm drainage cannot be made at the watershed scale or for agricultural production areas.
FFTF Goal(s):
- Improve drainage on existing farms
- Maintain viable farming economy/critical mass of farmland and farm businesses
Baseline Year:
2018
Status:
2020 results collected in 2021
Source(s):
Survey (responses)
- 2018 Result: On a scale of 1 (not an issue) to 10 (unable to farm land), drainage issues averaged a 3 in 2018, according to 11 farmers.
- 2020 Result: On a scale of 1 (not an issue) to 10 (unable to farm land), drainage issues averaged a 6 in 2020, according to 11 farmers.
$$ of FEMA Flood Claims
This metric is used to track the number of FEMA flood claims filed each year as well as their financial value. This metric does not track all of the damages from flood events, nor does it reflect the full economic impact of flooding. FEMA tracks the amount of flood damage claims made each year, which provides the basis for this metric.
FFTF Goal(s):
- Make communities more resilient to flooding and reduce flood risk and damage to private property
- Reduce flood risk and damage to public infrastructure
- Increase the resilience of flood management infrastructure, the ecosystem, and agriculture as climate changes
Baseline Year:
2013 (First year of reporting)
Status:
Baseline information established in 2021
Source(s):
Federal Emergency Management Agency
- 2013 Result: 1 claim, $0 in FEMA flood claims in Pierce County
- 2014 Result: 8 claims, $60,413 in FEMA flood claims in Pierce County
- 2015 Result: 18 claims, $160,316 in FEMA flood claims in Pierce County
- 2016 Result: 7 claims, $58,472 in FEMA flood claims in Pierce County
- Total: 34 claims, $279,201 in FEMA flood claims in Pierce County
There is no data available yet for 2017 – 2020
Salmonids
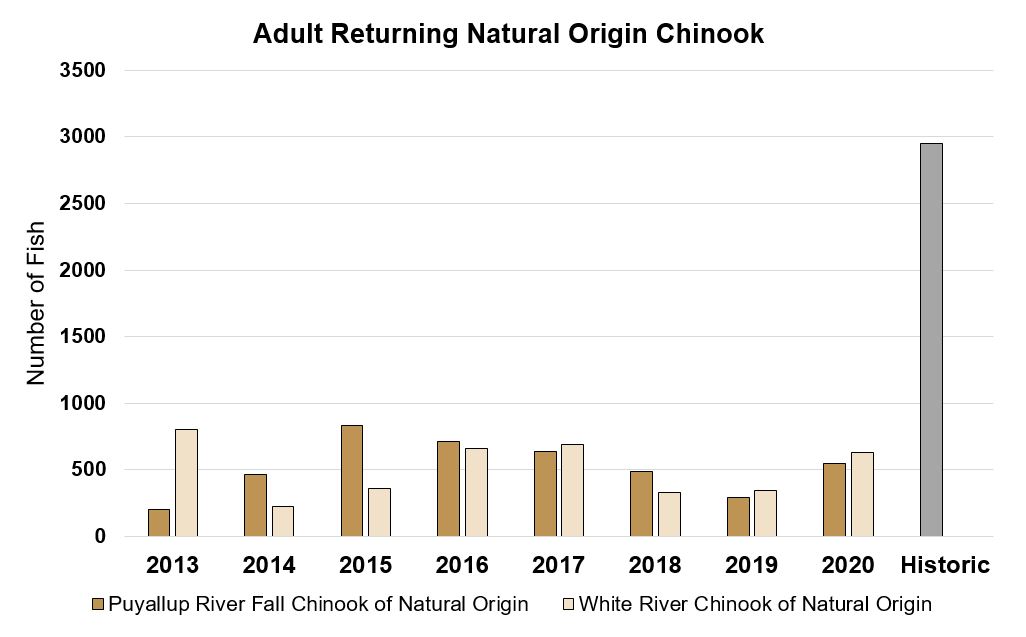
Salmon are an invaluable resource in the Puyallup Watershed and FFTF partners recognize the direct relationship between floodplain restoration and salmon abundance. As partners seek to reconnect historic floodplain and enhance habitat, they review data gathered by the Puyallup Tribe and the Washington Department of Fish and Wildlife on natural origin Chinook salmon abundance and juvenile productivity on the White and Puyallup Rivers.
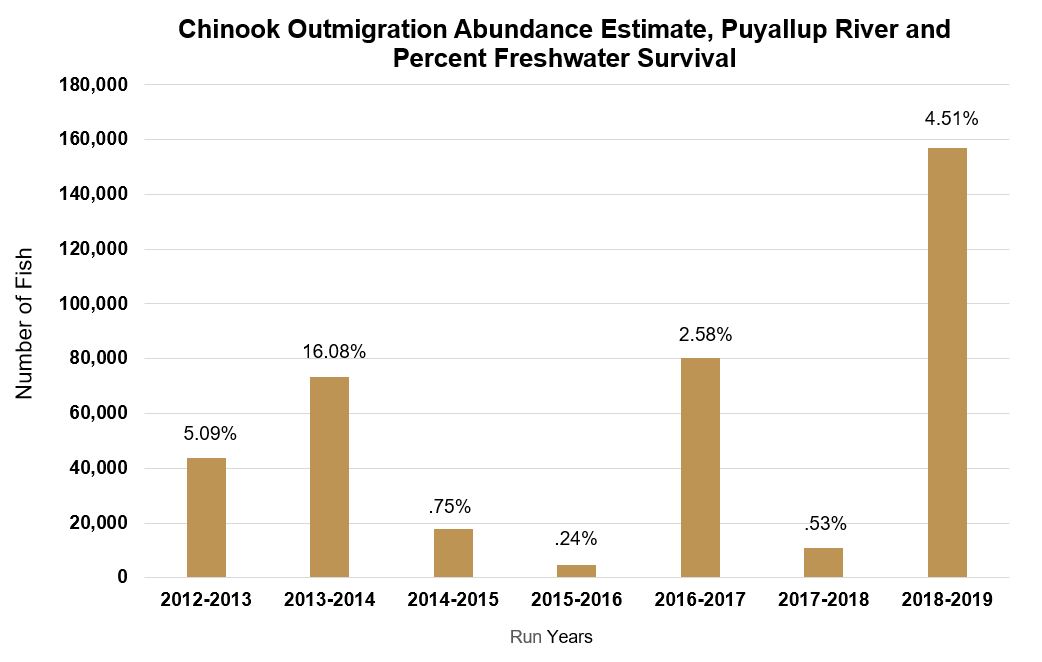
For a historic comparison, the WRIA 10/12 Lead Entity performed EDT modeling of the Puyallup Watershed to develop a current conditions baseline for Chinook salmon (Mobrand Biometrics 2000 and 2004). The results indicated greatly reduced abundances and exceptionally low productivity of less than two returning fish per spawner compared to estimated historic, pre-development values (seven to ten fish). Total current abundance for the watershed was about 2,000 salmon spawners (early 2000’s data), compared to a historic estimate of more than 64,000 fish (Salmon Habitat Protection and Restoration Strategy for Puyallup and Chambers Watersheds, June 2018). In combination with abundance, freshwater survival information provides an indication of productivity and overall watershed conditions. An ideal freshwater water survival result is 10%.
FFTF Goal(s):
Increase salmon abundance
Baseline Year:
2013
Status:
Greatly reduced abundances (from historic) and exceptionally low productivity
Source(s):
Puyallup Tribal Fisheries Department and Washington Department of Fish and Wildlife
2019 Results:
- White River Chinook of natural origin: 633 adult
- Puyallup River Fall Chinook of natural origin: 547 adult
- Puyallup River total Chinook outmigration abundance estimate: 156,935 fish
- Puyallup River juvenile freshwater survival rate: 4.51%